
- Example Spring application with logging
- Deploy a Spring Boot Application on Kubernetes
- Deploy a Grok Exporter as a sidecar on Kubernetes
- Deploy a Prometheus on Kubernetes
- Summary
In previous post, you have looked into Prometheus basics. In this part, it is time to create Prometheus service on the Kubernetes which can scrape metrics from additional metric exporter. It’s the perfect solution when you can’t export metrics from the application source code and your application logs the information you want to expose as metrics.
Example Spring application with logging
To understand how an grok exporter works, we must first create an application that logs some data to files.
I have prepared a very simple application in Spring Boot that has two functionalities:
-
Welcomes users entering the home page. If the user does not provide his name in
@RequestParam- the application will answer: Hello Guest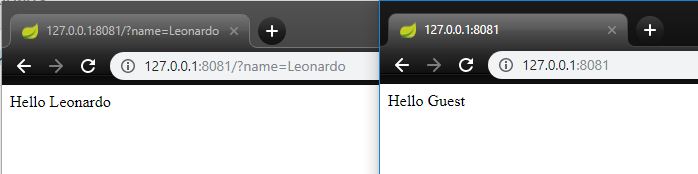
HelloController source code: Github
-
Every 10 seconds creates a log in the form: DATE TIME SERVICE_NAME CONNECTION_TIME.
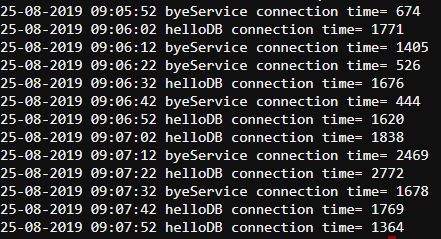
Service names are randomly selected from 3 defined names. Response times are also random. The logs are supposed to resemble real logs of the application connecting to other services and measuring the time of connection. The source code is on the Github
Logs are saved to the logs/applog.log file. Log4j configuration: 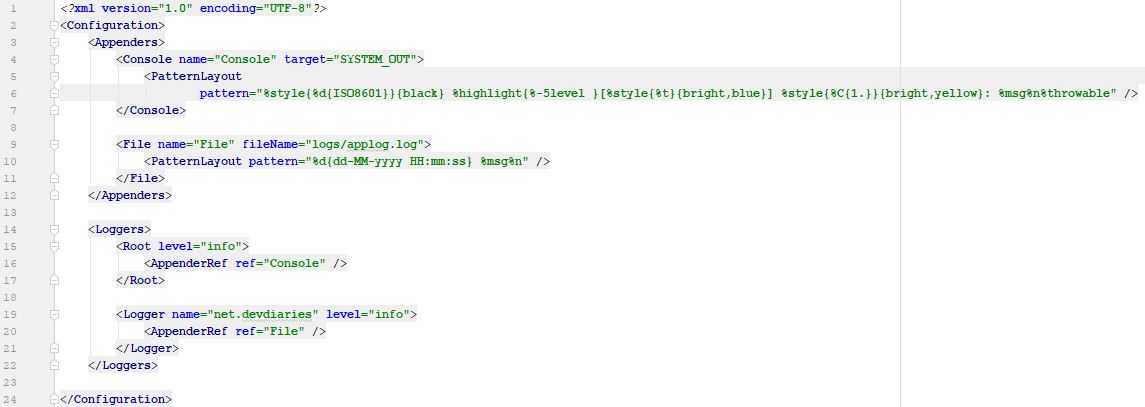 log4j.xml code: Github
Application code is also available on Github, docker image is on dockerHub.
Deploy a Spring Boot Application on Kubernetes
Firstly, we have to build docker image with application. I have already done it - image is pushed to the DockerHub. You can just import the image in the deployment definition (image: docker.io/michf/spring-logging-app:latest) for Kubernetes to deploy application.
If you want to create an image of your own application you can create a Dockerfile based on mine and push to the Dockerhub.
Now, we have to prepare Kubernetes deployment configuration. Let’s start from the Deployment config:
          apiVersion: apps/v1
          kind: Deployment
          metadata:
            name: spring-logging-app
            labels:
              app: spring-logging-app
          spec:
            replicas: 1
            selector:
              matchLabels:
                app: spring-logging-app
            template:
              metadata:
                labels:
                  app: spring-logging-app
              spec:
                containers:
                  - name: spring-logging-app
                    image: docker.io/michf/spring-logging-app:latest
                    ports:
                      - containerPort: 8080
Service definition:
apiVersion: v1
kind: Service
metadata:
  name: spring-logging-app
spec:
  type: ClusterIP
  ports:
    - protocol: TCP
      targetPort: 8080
      port: 8080
    selector:
        sidecar: spring-logging-app
That’s all. You can deploy logging application on Kubernetes.
Deploy a Grok Exporter as a sidecar on Kubernetes
We will be collecting data from our logs using a sidecar container. A sidecar container is a secondary container which is run within the same Pod. In our case grok exporter will be a sidecar container.
To configure sidecar pattern, we will create a volume (with /logs path) for our Pod to be shared by all containers in the Pod. Then we will configure grok exporter to read logs from shared location.
Firstly, we have to create grok service. Service will be a target in Prometheus:
apiVersion: v1
kind: Service
metadata:
  name: grok-exporter
  labels:
    sidecar: grok-exporter
spec:
  type: ClusterIP
  ports:
    - protocol: TCP
      targetPort: 9144
      port: 9144
    selector:
        sidecar: grok-exporter
9144 is a default grok exporter port.
Log capture using grok exporter in Kubernetes
To capture logs we need to create a configuration file. For this purpose we will use Kubernetes ConfigMap:
kind: ConfigMap
metadata:
name: grok-exporter
apiVersion: v1
data:
config.yml: |-
global:
config_version: 2
input:
type: file
fail_on_missing_logfile: false
path: /logs/applog.log
grok:
patterns_dir: ./patterns
metrics:
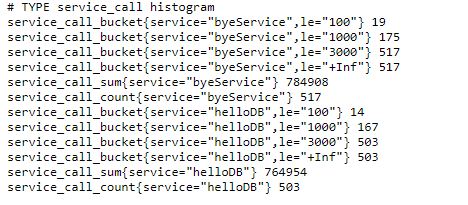
- type: histogram
name: service_call
help: Services call times
match: '%{DATE} %{TIME} %{WORD:service} connection time= %{INT:val}'
value: ''
buckets: [100, 1000, 3000]
labels:
service :'{{.service}}'
- type: counter
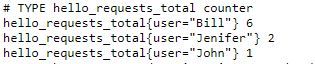
name: hello_requests_total
help: Hello controller requests counter
match: '%{DATE} %{TIME} HelloController request from: %{USER:user}'
labels:
user : '{{.user}}'
server:
port: 9144Configmap will create and mount the config.yml file (configuration for grok exporter). In config.yml we set the path to the mounted volume (/logs/applog.log) and two types of metrics. The histogram will inform you about how many connections to external services took less than 100 ms, how many calls took more than 100, but less than 1000, and how many calls lasted more than 3000 ms. Counter will inform you how many http requests has served our application for a given user.
The match: property is an expression pattern. You can find all grok patterns on the Github. Then you can adjust the pattern to catch your logs.
Let’s add volume and grok exporter image to the deployment definition from previous point:
apiVersion: apps/v1
kind: Deployment
metadata:
name: spring-logging-app
labels:
app: spring-logging-app
spec:
replicas: 1
selector:
matchLabels:
app: spring-logging-app
sidecar: grok-exporter
template:
metadata:
labels:
app: spring-logging-app
sidecar: grok-exporter
spec:
containers:
- name: spring-logging-app
image: docker.io/michf/spring-logging-app:latest
ports:
- containerPort: 8080
volumeMounts:
- name: logs
mountPath: /logs/
- name: grok
image: palobo/grok_exporter
imagePullPolicy: Always
ports:
- containerPort: 9144
protocol: TCP
volumeMounts:
- name: grok-config-volume
mountPath: /etc/grok_exporter
- name: logs
mountPath: /logs
volumes:
- name: grok-config-volume
configMap:
name: grok-exporter
- name: logs
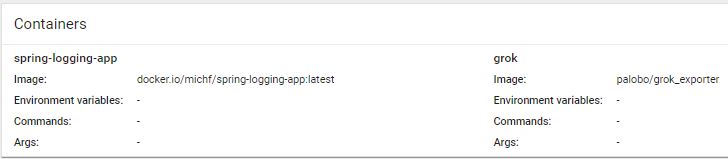
emptyDir: {}Now, we can deploy above Deployment. After entering the pod via Kubernetes Dashboard, you should see information about two containers (from grok and from the logging application):
Let’s check if grok expese endpoint wiht metrics. I used kubectl port-forward pod-name port:port to forward a grok port to localhost
kubectl port-forward spring-logging-app-79bb56876-c4h29 9144:9144 You can go to 127.0.0.1:9144/metrics and check the application metrics based on the logs:.
Counter metrics:
Histogram metrics:
Deploy a Prometheus on Kubernetes
Prometheus ConfigMap
Firstly, create a configmap with the Prometheus scrape config:
apiVersion: v1
kind: ConfigMap
metadata:
  name: prometheus
data:
  prometheus.yml: |-
    global:
      scrape_interval: 15s
    scrape_configs:
    - job_name: 'grok'
      static_configs:
      - targets: ['grok-exporter:9144']
Prometheus will collect information from the grok-exporter service every 15 seconds.
Prometheus Deployment
In Prometheus deployment config We have to mount created a moment ago config map as a file inside /etc/prometheus:
apiVersion: apps/v1
kind: Deployment
metadata:
  name: prometheus
spec:
  selector:
    matchLabels:
      app: prometheus
  replicas: 1
  template:
    metadata:
      labels:
        app: prometheus
    spec:
      containers:
        - name: prometheus
          image: prom/prometheus:v2.12.0
          ports:
            - name: web
              containerPort: 9090
          volumeMounts:
            - name: prometheus-config
              mountPath: /etc/prometheus
            - name: prometheus-data
              mountPath: /prometheus
            volumes:
                - name: prometheus-data
          emptyDir: {}
                    - name: prometheus-config
          configMap:
                  name: prometheus
Prometheus Service
To acces the Prometheus GUI over an IP/DNS, we need to expose it as a service:
apiVersion: v1
kind: Service
metadata:
  name: prometheus
  labels:
    app: prometheus
spec:
  selector:
    app: prometheus
  type: NodePort
  ports:
    - protocol: TCP
      name: web
      nodePort: 31199
      port: 9090
      targetPort: 9090
Summary
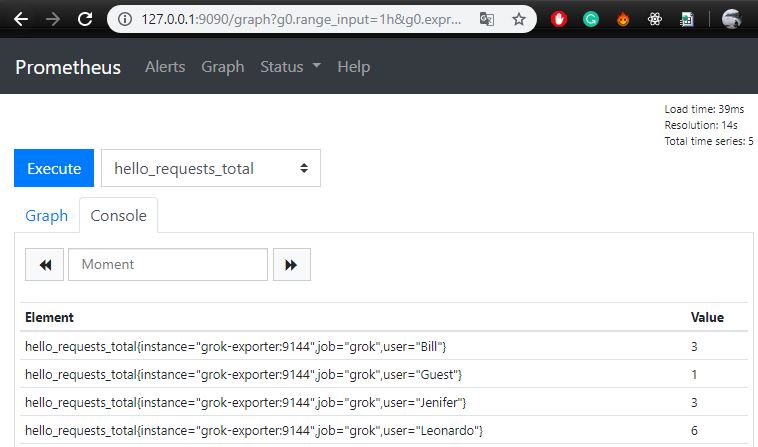
Now we can access the Prometheus dashboard using kubectl port-forward
Thank you for reading! I hope you enjoyed the post.